We manage over 10 shared runners within our GitLab instance, and, as an administrator, I aim to oversee their performance and ensure their operational integrity. The complexity lies in the fact that these runners are both physical and virtual machines, distributed across various subnets.
After reading some documentation, I resolved to use the GitLab-powered exporter for metric transmission, Prometheus for time series data storage, and Grafana for visualization to meet my requirements.
To avoid overburdening the primary GitLab server, my plan is to install Prometheus and Grafana on a separate node. I’ve identified a server that operates within the same subnet as the GitLab servers. This choice is motivated by the fact that Prometheus metric data lacks encryption, and as a result, it cannot traverse the internet.
Find out the metrics
Initially, I referenced this document with the intention of extracting data from it. However, I soon discovered that the exporters had to be installed on each of the runners. Furthermore, they needed to communicate on an uncommon port from the Prometheus server to the runners. This poses a significant challenge for me since all the runners are situated in different subnets, and it’s quite challenging to open these ports, possibly due to security constraints. Consequently, I’m seeking an alternative source for retrieving the data.
I have noticed that there is UI for showing some GitLab CI runners, and I wonder if these information has been stored in database or some other persistent area. I have read the source code of the gitlab exporter, and found out that they actually have a few metrics exported about the runners.
CI builds -- ci_pending_builds, ci_created_builds, ci_stale_builds, ci_running_builds
While not offering highly detailed data, it did provide some clues, particularly when a CI process encountered failures or became unresponsive. This enabled me to investigate the issues on the GitLab server and discern what was causing the problem.
The information is conveniently accessible via any front-end GitLab nodes, and since the GitLab server resides in the same subnet as the Prometheus server, the data can be readily obtained.
Install Prometheus
GitLab has seamlessly integrated Prometheus into the Omnibus setup. To enable this, all that’s required is the installation of the gitlab-ce package and the configuration of the /etc/gitlab/gitlab.rb file as per the following instructions. In accordance with the details provided in the GitLab documentation, I’ve configured my gitlab.rb file as shown below.
roles ['monitoring_role']

# Prometheus
prometheus['listen_address'] = '0.0.0.0:9090'
prometheus['monitor_kubernetes'] = false

# Grafana
grafana['enable'] = true
grafana['admin_password'] = 'toomanysecrets'
grafana['disable_login_form'] = false


# Nginx - For Grafana access
nginx['enable'] = true
Within the configuration settings, I specified the role as ‘monitoring_role’ and activated Prometheus and Grafana. I opted not to utilize Consul, given that it’s a licensed feature, but this decision did not pose any issues, as Prometheus seamlessly received the metrics.
Install GitLab exporter
On any of the GitLab front-ends nodes, enable GitLab exporter as the following.
gitlab_rails['prometheus_address'] = 'x.x.x.x:9090'

prometheus['enable'] = false

gitlab_exporter['enable'] = true
gitlab_exporter['listen_address'] = '0.0.0.0'
gitlab_exporter['listen_port'] = '9168'
Now try to check metrics from the exporter.
curl "http://localhost:9168/metrics" | grep ci
The result is as following.
ci_stale_builds 0.0
ci_running_builds{namespace="",runner="308",runner_type="1",scheduled="no",triggered="no"} 5.0
ci_running_builds{namespace="",runner="319",runner_type="1",scheduled="no",triggered="no"} 4.0
ci_unarchived_traces 0.0
ci_pending_builds 0.0
ci_created_builds 1.0
Configure promethus server to receive metrics
In /var/opt/gitlab/promethus/prometheus.yml file, modify the config file to be the following.
---
global:
  scrape_interval: 15s
  scrape_timeout: 15s
  external_labels: {}
remote_read: []
remote_write: []
rule_files:
- "/var/opt/gitlab/prometheus/rules/*.rules"
scrape_configs:
- job_name: prometheus
  static_configs:
  - targets:
    - 0.0.0.0:9090
- job_name: database
  metrics_path: "/metrics"
  static_configs:
  - targets:
    - x.x.x.x:9168
alerting:
  alertmanagers:
  - static_configs:
    - targets:
      - localhost:9093
Now just reload the Prometheus server.
gitlab-ctl hup prometheus
Check config at Prometheus server
Check the config at http://localhost:9090/config, and there should be the config for reading metrics from database.
- job_name: database
  honor_timestamps: true
  scrape_interval: 15s
  scrape_timeout: 15s
  metrics_path: /metrics
  scheme: http
  follow_redirects: true
  enable_http2: true
  static_configs:
  - targets:
    - x.x.x.x:9168
Add GitLab CI graph on Grafana
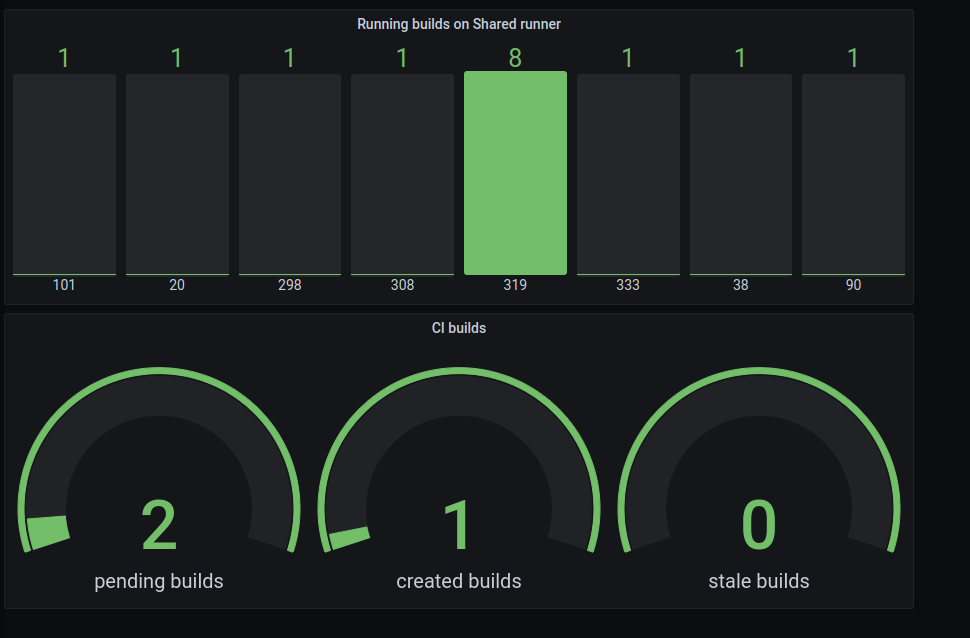
On Grafana, I added the metrics (ci_pending_builds, ci_created_builds, ci_stale_builds, ci_running_builds) that I got from GitLab front-end node and made the following image. The JSON model file is defined as below.
{
  "annotations": {
    "list": [
      {
        "builtIn": 1,
        "datasource": "-- Grafana --",
        "enable": true,
        "hide": true,
        "iconColor": "rgba(0, 211, 255, 1)",
        "name": "Annotations & Alerts",
        "type": "dashboard"
      }
    ]
  },
  "editable": true,
  "gnetId": null,
  "graphTooltip": 0,
  "id": 12,
  "iteration": 1697156908056,
  "links": [],
  "panels": [
    {
      "datasource": null,
      "fieldConfig": {
        "defaults": {
          "color": {
            "mode": "thresholds"
          },
          "mappings": [],
          "thresholds": {
            "mode": "absolute",
            "steps": [
              {
                "color": "green",
                "value": null
              },
              {
                "color": "red",
                "value": 80
              }
            ]
          }
        },
        "overrides": []
      },
      "gridPos": {
        "h": 8,
        "w": 12,
        "x": 0,
        "y": 0
      },
      "id": 6,
      "options": {
        "displayMode": "gradient",
        "orientation": "auto",
        "reduceOptions": {
          "calcs": [
            "lastNotNull"
          ],
          "fields": "",
          "values": false
        },
        "showUnfilled": true,
        "text": {}
      },
      "pluginVersion": "7.5.16",
      "targets": [
        {
          "exemplar": true,
          "expr": "ci_running_builds{runner_type=\"1\",scheduled=\"no\",triggered=\"no\", instance=~\"$database\"}",
          "instant": false,
          "interval": "",
          "legendFormat": "",
          "refId": "A"
        }
      ],
      "timeFrom": null,
      "timeShift": null,
      "title": "Running builds on Shared runner",
      "type": "bargauge"
    },
    {
      "datasource": null,
      "fieldConfig": {
        "defaults": {
          "color": {
            "mode": "thresholds"
          },
          "mappings": [],
          "thresholds": {
            "mode": "absolute",
            "steps": [
              {
                "color": "green",
                "value": null
              },
              {
                "color": "red",
                "value": 80
              }
            ]
          }
        },
        "overrides": []
      },
      "gridPos": {
        "h": 8,
        "w": 12,
        "x": 0,
        "y": 8
      },
      "id": 4,
      "options": {
        "orientation": "auto",
        "reduceOptions": {
          "calcs": [
            "lastNotNull"
          ],
          "fields": "",
          "values": false
        },
        "showThresholdLabels": false,
        "showThresholdMarkers": true,
        "text": {}
      },
      "pluginVersion": "7.5.16",
      "targets": [
        {
          "exemplar": true,
          "expr": "sum(ci_pending_builds{instance=~\"$database\"})",
          "hide": false,
          "instant": false,
          "interval": "",
          "legendFormat": "pending builds",
          "refId": "B"
        },
        {
          "exemplar": true,
          "expr": "sum(ci_created_builds{instance=~\"$database\"})",
          "hide": false,
          "interval": "",
          "legendFormat": "created builds",
          "refId": "C"
        },
        {
          "exemplar": true,
          "expr": "ci_stale_builds{instance=~\"$database\"}",
          "hide": false,
          "interval": "",
          "legendFormat": "stale builds",
          "refId": "D"
        },
        {
          "hide": false,
          "refId": "A"
        }
      ],
      "timeFrom": null,
      "timeShift": null,
      "title": "CI builds",
      "type": "gauge"
    }
  ],
  "refresh": false,
  "schemaVersion": 27,
  "style": "dark",
  "tags": [],
  "templating": {
    "list": [
      {
        "allValue": null,
        "current": {
          "selected": true,
          "text": [
            "x.x.x.x:9168"
          ],
          "value": [
            "x.x.x.x:9168"
          ]
        },
        "datasource": null,
        "definition": "label_values(up{job=\"database\"}, instance)",
        "description": null,
        "error": null,
        "hide": 0,
        "includeAll": false,
        "label": null,
        "multi": true,
        "name": "database",
        "options": [
          {
            "selected": false,
            "text": "x.x.x.x:9168",
            "value": "x.x.x.x:9168"
          },
          {
            "selected": true,
            "text": "x.x.x.x:9168",
            "value": "x.x.x.x:9168"
          }
        ],
        "query": {
          "query": "label_values(up{job=\"database\"}, instance)",
          "refId": "StandardVariableQuery"
        },
        "refresh": 0,
        "regex": "",
        "skipUrlSync": false,
        "sort": 0,
        "tagValuesQuery": "",
        "tags": [],
        "tagsQuery": "",
        "type": "query",
        "useTags": false
      }
    ]
  },
  "time": {
    "from": "now-6h",
    "to": "now"
  },
  "timepicker": {},
  "timezone": "",
  "title": "GitLab Omnibus - GitLab runner",
  "uid": "ILdcpCmIk",
  "version": 34
}
Credit: Photograph taken of the real monitor arrangement displayed on a Windows Surface Laptop.